PVSS Help for CMS ECAL SM0 TSS
TSS - General PVSS Application for TSS Setup of TSS PLC with Siemens S7 Software
Frequently Asked Questions (or ... How to do it?)
The main objective of CMS ECAL TSS for SM0 is to provide:
· Independent and continuous monitoring and archiving of temperature data of ECAL FE and VFE environment;
· Continuous monitoring and archiving of Cooling System Status (cooling water flow, cooling water temperature and PLC status) and TSS System Status information for later analysis of system and detector performance;
· Reliable hardwired interlocks to High Voltage (HV) and Low Voltage (LV) Power Supplies Systems;
·
Prompt reaction on any Alarm Situation by issuing, in a proper
time sequence, warnings and Alarms to:
HV and LV System (hardwired interlocks),
Control Room Operator (soft PVSS Warning and Alarm);
· Hardwired interface to DSS (BBL3) System for status monitoring of the TSS PLC.
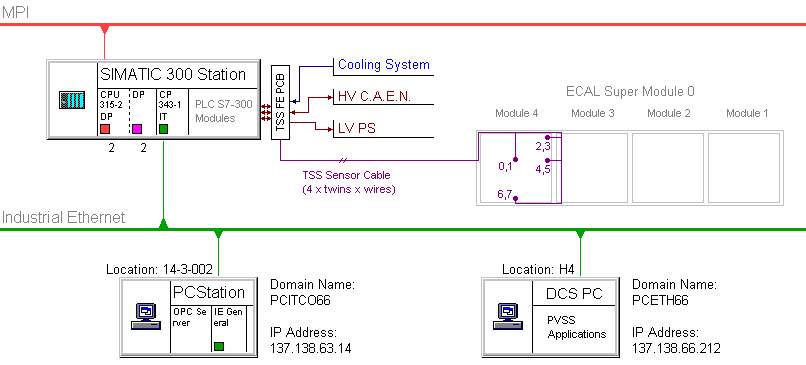
For this reason CMS ECAL TSS have appropriate interfaces to four ECAL sub-Systems: Cooling System, HV System C.A.E.N. Crate, LV System Rack and DSS BBL3 System. The stand-alone operation of the TSS system is provided by Siemens S7-300 Family PLC. The connection to the DCS monitoring computer is established via Industrail OPC Connection through the Ethernet, and monitoring application is built with PVSS II Scada Tool. The TSS organization and connections to the other ECAL systems in the case for SM0 testing during the Summer 2003. is shown in the Figure below.
NOTE FOR SHIFTERS : do not panic in case the TSS PVSS panel is not there any more, or the TSS PVSS application is not running at all. This does NOT mean that the safety system is not operating. The PLC is still operating and will switch off LV and HV in case of a problem. In order to be sure about that (when you lost the monitoring), go to the DCS rack (close to the Laser barrack), on the left of the LV rack. In the back of the rack there is the PLC, and below there is a PCB with two LEDs. If both are GREEN, everything is fine, otherwise an alarm was generated.
Figure 0.
OPC Server and PVSS Start-up
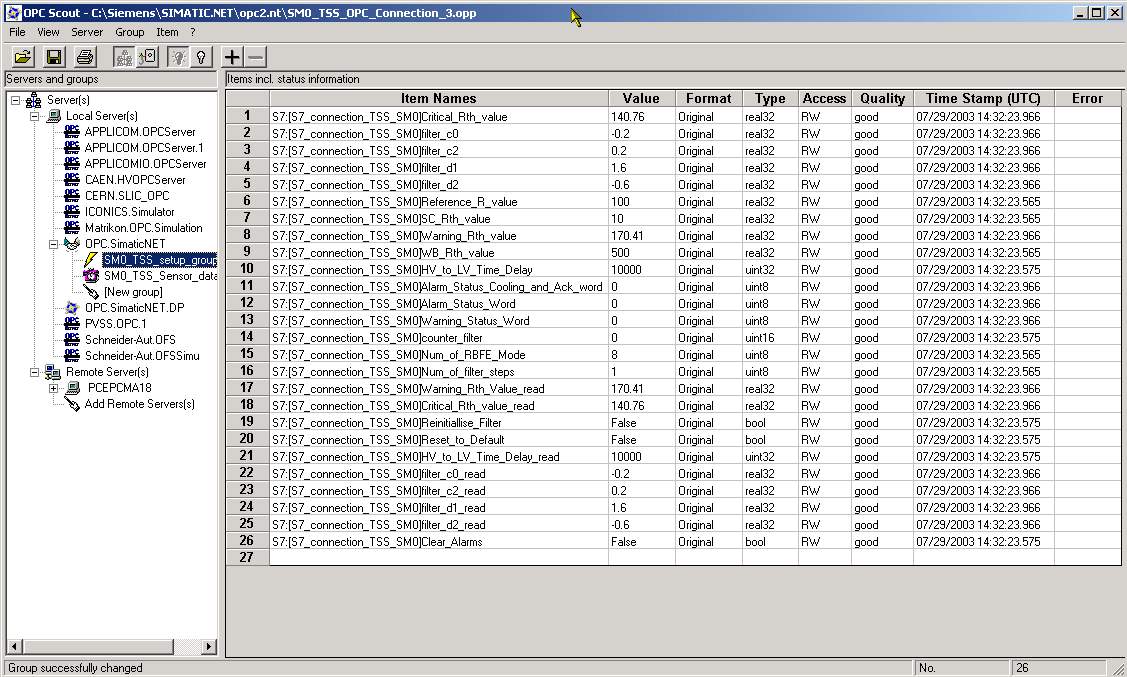
The OPC Server is automatically started when you start up the PC. Status of the OPC server and OPC connection can be checked with any OPC client, e.g. with OPC Scout that can be accessed via its shortcut on the desktop: "OPC Scout.lnk". After the OPC Scout has been loaded, one should open file "SM0_TSS_OPC_Connection_3.opp" within the client (Scout). The OPC table with connections relevant for TSS (similar to the one shown on Figure 1.) should appear on the screen.
The column "Quality" in OPC table under OPC.SimaticNET group shows the quality of OPC connection. The Quality value "bad" means that OPC connection is not established or is not functioning properly at the moment. The value Quality "good" means that the OPC connection is established properly.
Figure 1.
After the status of OPC connection has been checked, you can close the OPC client window. On prompt: "Do you want to save your current project?" - choose: "No".
Important: PVSS should be started only if OPC server (connection) runs properly (Quality=good).
In order to be able to start PVSS, you have to be logged into account with administrator privileges for the local machine. If you don't have these privileges with your standard NICE account, you can use generic NICE account for CMS ECAL test-beam:
Username: cmsecdcs
Password: Alison
Once you have logged into this PC with a proper account, you can start PVSS from the Start Menu in the following way:
Start Menu -> Programs -> PVSS II 2.12.1 -> PVSS Console
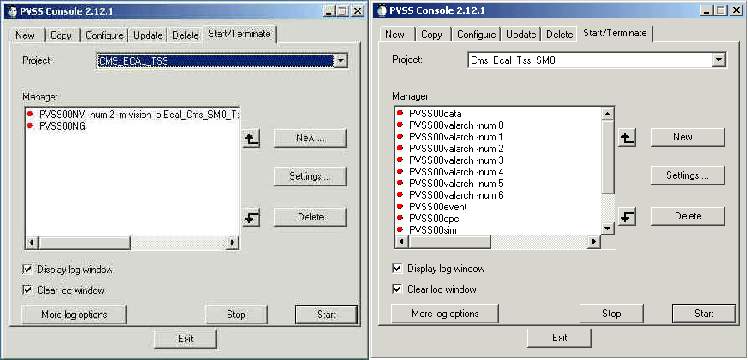
The panel similar to the one below should appear on the screen:
Figure 2.
The TSS Project from the PVSS console can be started in the following way:
Select Cms_Ecal_Tss_Sm0 (or CMS_ECAL_TSS) project from the Project list in PVSS console (in Start/Terminate Tab)
Press button Start and wait until the project starts up. This can take several minutes.
If all the "lamps" at the PVSS Console are green or read, but none of them is flashing red/yellow - the project is being started-up successfully. Otherwise, there has been a problem starting one of PVSS Managers (in this case you should see log file for details).
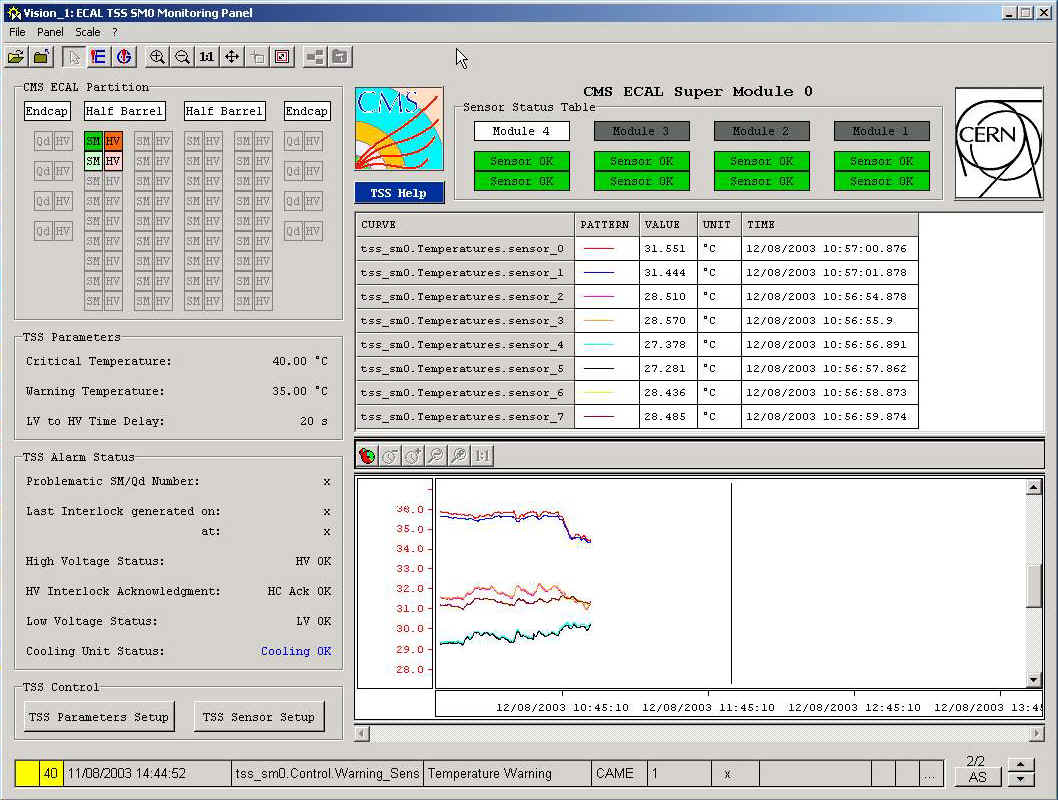
If all the managers in the project have been started up successfully, the following TSS Panel should appear (Figure 3.):
Figure 3.
TSS Panel description
The basic outlook of the ECAL SM TSS Monitoring Panel is shown on the Figure 3. It can be divided into 3 logical areas (see Figure 4):
ECAL SM selection Area - the upper left frame of the TSS panel
TSS parameters and interlock status Area - two lower frames at the left part of the TSS panel
SM temperature and sensor status monitoring Area - the right part of the TSS panel
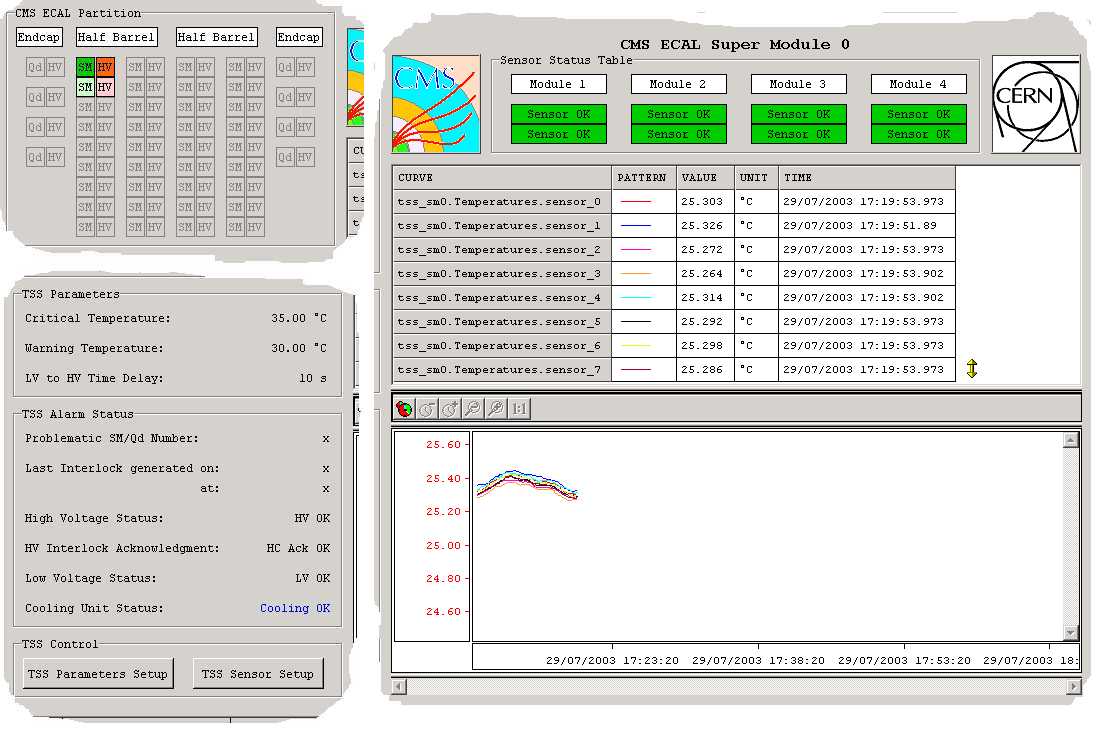
Figure 4.
ECAL SM selection can simply be performed by left mouse button click on the desired SM "field" in the ECAL Partition Frame. Upon the click, the title of the left-frame area shows you which SM is currently selected (during the test-beam period only first two SMs will be enabled/operational). All the data displayed thereafter are related to the sensors inside the selected SM. The color of the SM "field" can be: dark green (SM selected, status: OK), light green (SM not selected, status: OK) or flashing red/yellow (status: Alarm!)
The right part of the TSS Panel contains Sensor Status Table and Trend of SM Temperatures. Sensor Status Table shows the current status of each of twin sensors in each SM module. Sensor Status string can take one of the following values:
Sensor OK - sensor functions normally. Temperature values shown in the Trend are valid;
Wire Break - readout of the sensor indicates possible wire break. Temperature values in the Trend are not updated;
Short Circuit - readout of the sensor indicates possible short circuit. Temperature values in the Trend are not updated;
Disabled - sensor has been disabled in Sensor Setup Panel. Temperature values in the Trend are valid, but sensor can not generate any Warning or Alarm;
SM Temperature Trend shows the change of the temperatures inside the SM over elapsed time. The relation Modules-Sensors is as follows (the color of the sensor number corresponds to the color of its curve in the TSS Temperature Trend):
Sensors 0, 1 - Module 4 (the module where electronics in SM0 and SM1 is installed)
Sensors 2, 3 - Module 3
Sensors 4, 5 - Module 2
Sensors 6, 7 - Module 1
Note: For SM0 test all the sensors have been placed inside M4 in order to monitor temperature distribution within the module. Positions of these sensors are shown on the sketch below:
Module 4
67
45 E E
E 01 E
23 E E
Manipulations with the Plot and the change of time/value intervals shown in the Trend can be done by Trend Toolbar located at the upper left part of the Plot. The first button on the left side of the toolbar is "green/red" clock
. It can be used to freeze the Trend and enable the change of time/value intervals, or to "defreeze" the Trend Tool. Time/value intervals shown in the Trend can be changed with other 5 buttons on this toolbar. The function of each of these buttons is as follows:
- decreases the time interval over which temperature values are plotted. The temperature value interval is preserved.
- increases the time interval over which temperature values are plotted. The temperature value interval is preserved.
- decreases the temperature interval over which temperature values are plotted. The time value interval is preserved.
- increases the temperature interval over which temperature values are plotted. The time value interval is preserved.
- all temperature and time intervals are automatically adjusted to show all the data on the Plot.
Alarm/Interlock information and acknowledgement
In the case of an Alarm Situation, hardwired interlocks are issued and HV and LV systems are shutdown in a proper time sequence. A situation is considered an Alarm Situation in following cases:
Temperature in any of the SM modules has reached the critical value (the critical temperature can be set-up in TSS Setup Panel under Interlock Tab).
ACTION: Check the temperature Trend for recent trend of the temperatures in the SM modules and identify a faulty module. Check if HV and LV Systems have been shutdown properly. Immediately contact any ECAL DCS Expert!
There has been a problem with either SM cooling water flow or SM cooling water temperature
ACTION: Check CMS_ECAL_COOLING panel for status of the Cooling System. Check if HV and LV Systems have been shutdown properly. Immediately contact a SM Cooling Experts and ECAL DCS Experts!
There has been a problem with SM Cooling PLC.
ACTION: Check CMS_ECAL_COOLING panel for status of the Cooling System. Check if HV and LV Systems have been shutdown properly. Immediately contact a SM Cooling Experts and ECAL DCS Experts!
The most important information about the Alarms can be found within "TSS Alarm Status" frame (see Figure 5.).
Figure 5.
It contains the information about:
The time and the date when an Alarm Situation has occurred and the number of SM where the situation has occurred.
HV Interlock Status:
OK - means no kill signal is being sent to the HV system.
HV Kill - a kill signal is being sent to the HV system.
HV Interlock Acknowledgment Status:
HV Ack OK - the HV kill signal has been acknowledged from HV System.
HV Not Ack - the HV kill signal has NOT been acknowledged from HV system. This indicates two possible situations: 1) a wire break in the HV interlock cable or 2) HV interlock cable has been plugged out from TSS Interlock Interface Board next to the TSS PLC.
NOTE: If HV is not shutdown in time, the damage of FPPA chips can occur!!!
ACTION: Check at the HV C.A.E.N. crate if HV channels have really been turned off. If appropriate channels are still ON - contact HV Experts and turn off the channels manually!
LV Interlock Status:
OK - means no kill signal is being sent to the LV system.
LV Kill - a kill signal is being sent to the LV system.
Cooling Unit Status:
Cooling OK - means there's no problem with the SM Cooling system.
Cooling Problem - there has been a problem with either SM cooling water flow or SM cooling water temperature.
PLC Problem - there has been a problem with SM Cooling PLC.
An example of the outlook of "Alarm Status" Frame at the moment when HV Kill signal has been issued, but not acknowledged, is shown in the Figure 6. The LV Kill signal has not been issued yet.
Figure 6.
An example of the outlook of "Alarm Status" Frame when LV Kill signal has been issued (e.g. 30 seconds after the HV Kill signal) is shown in the Figure 7.
Figure 7.
Redundant Alarm Information Messages are showed in the PVSS Alarm Row. There are two types of these messages: Incoming Alarm Message (CAME) and Outgoing Alarm Message (WENT). The messages of both of these types must be acknowledged in order to be removed from the queue. Messages are removed from the queue only if they have been acknowledged and if there are corresponding (and acknowledged) "WENT" Alarm Messages. Two examples of "CAME" and "WENT" type Alarm Messages are shown in the Figure 8.:
Figure 8.
The complete table with all pending Alarms and Warnings can be accessed from PVSS Alarm Row by "AS" button. This table can be used for preview and (eventually) for acknowledgment of all pending Alarms/Warnings.
Similar to Alarm Messages, Warning Messages are issued in the case of Warning Situations (the situation when any module temperature has reached the Warning Temperature; the warning temperature can be set-up in TSS Setup Panel under Interlock Tab).
ACTION: Keep monitoring temperatures inside the "warning" modules closely - there might be a possibility of reaching the critical temperature and having an Alarm situation. Inform ECAL DCS Experts!
An example of such a message is given in Figure 9.:
Figure 9.
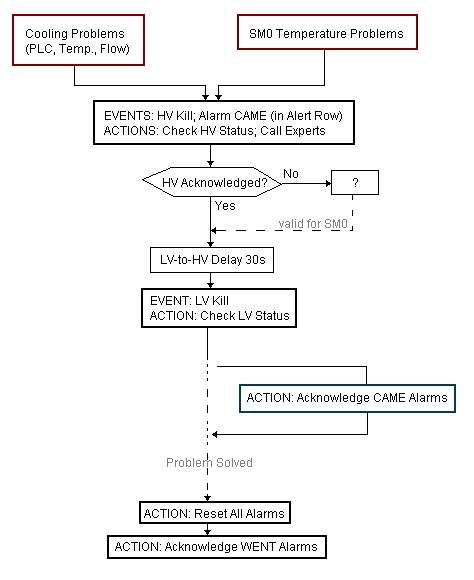
In general, the flow chart of sequences: Alarm Situation -> Events -> Actions that can occur during SM0 testing is given in the Flow Chart 1.
Flow Chart 1.
The Sensor Status Panel can be accessed from the TSS Monitoring Panel by left-button mouse click on the "TSS Sensor Setup" button. The click on this button opens up the Sensor Status Tab similar to the one shown on Figure 10.
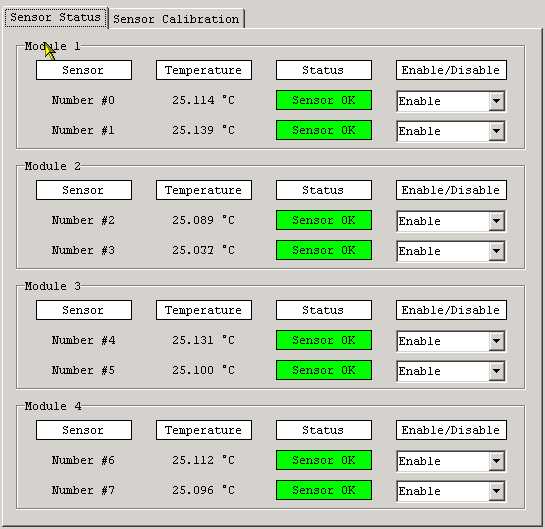
Figure 10.
Enabling or disabling of any sensor inside the selected SM can be done within the Sensor Status Tab by selecting the desired value (Enable or Disable) in appropriate check-box on the right side of the Panel. The temperature of any Disabled sensor will be monitored, but the readout of this sensor CAN NOT cause an Alarm Situation or generate interlock signal.
TIP: This action (disabling some sensors) can be useful in the case of misbehavior or malfunction of any of the SM temperature sensors.
The TSS Control Panel can be accessed from the TSS Monitoring Panel by left-button mouse click on the "TSS Parameters Setup" button. The click on this button opens up the Interlock Tab on TSS Control Panel similar to the one shown in the Figure 11.
Figure 11.
Interlock Tab allows one to perform:
Changing of the Critical/Warning Temperature: A new value should be entered in an appropriate Edit-Box in Celsius Degrees and confirmed with the <Enter> command;
Changing of the LV-to-HV delay: A new value should be entered in appropriate Edit-Box in seconds and confirmed with the <Enter> command;
Showing of the Alarms/Warning history: The click on the appropriate button opens up the Alarm/Warnings History Panel.
Digital Filter Tab (Options within this Tab will not be enabled for SM0/SM1 tests)
Figure 12.
A click on this button clears a current Warning and all Alarms in the PLC memory. But, if the cause of the Alarm/Warning situation is still present in the system, the Alarm/Warning will likely be issued again! (NOTE: Before this function is executed, one more dialog box will be opened)
TIP: This function is useful to clear all Alarms/Warning when the cause of Alarm/Warning situation has been identified and removed from the system.
Re-initialize Filter (This button will not be enabled for SM0/SM1 tests)
Reset all Filter Data (This button will not be enabled for SM0/SM1 tests)
A click on this button resets all the data in the PLC memory to its default values. It is equivalent to PLC Warm Restart command. (NOTE: Before this function is executed, one more dialog box will be opened)
TIP: This function might be useful in some serious problems, e.g. the unexpected behavior of the system that cannot be corrected by any other procedure.
3. Setup/Monitoring of TSS PLC with Siemens STEP7 software
In order to use Siemens SIMATIC and STEP7 software for configuring and control of Siemens PLCs, one has to start SIMATIC Manager and to open appropriate project first. Siemens SIMATIC Manager can be started from the Start Menu in the following way:
Start Menu -> Simatic -> SIMATIC Manager
Upon the start-up of SIMATIC Manager, the following "New Project" dialog box will automatically appear (Figure 13.):
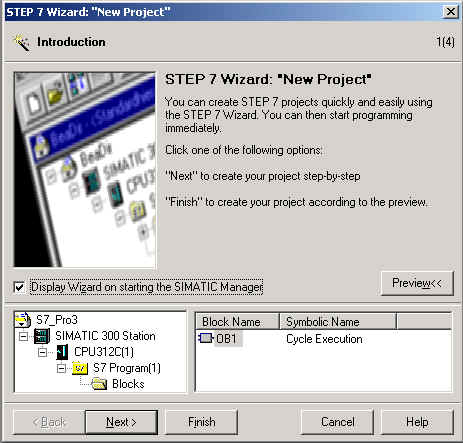
Figure 13.
This box should be closed with the "Cancel" button, and afterwards, an existing project should be open with the "Open" button located at the SIMATIC Manager Toolbar. After the Open button has been pressed, the following "Open Project" Dialog Box will appear (Figure 14.):
Figure 14.
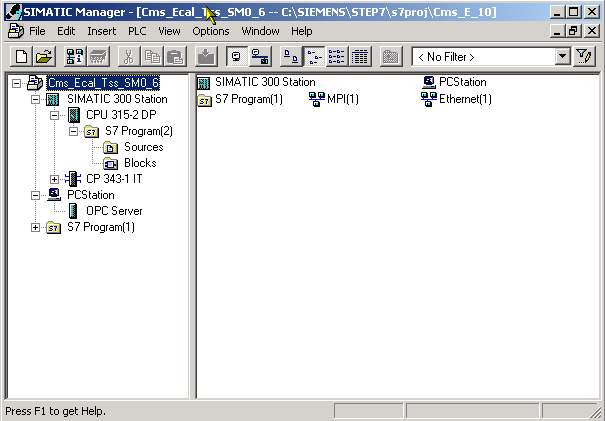
The project for the control of TSS PLC for SM0 test is named "Cms_Ecal_Tss_SM0_6" and should be selected within this Dialog Box. After the OK button has been pressed, the Manager will open the (selected) TSS Project, and the Manager window will have a look as it is shown in the Figure 15.
Figure 15.
The Project browsing tree on the left-hand side of SIMATIC Manager Window helps you to select a part of the system you would like to monitor or configure. The meaning and purpose of each node of the tree is the following:
"SIMATIC 300 Station" - Contains sub-nodes CPU 315-2DP and CP 343-IT, and the leaf "Hardware". This leaf can be used to access Hardware Configuration Manager (HW Config - Figure 16.) for the current project. This Manager can be used to configure all hardware components of the selected PLC system (see below).
"PC Station" - Contains one sub-node "OPC Server" and one leaf "Configuration". This leaf can be used to access the Hardware Configuration Manager (HW Config) for the PC Station component configuration.
"CPU 315-2DP" - Contains two sub-nodes: "Sources" and "Blocks", and one leaf "Connections". This leaf can be used to access Network Connections Configuration Manager (NetPro - Figure 17.) for the current project. This Manager can be used to configure IP addresses of Ethernet Modules for all the Stations available in the Project Tree (see: Configuring Network parameters and connections).
"CP 343-IT" - (not to be used)
"OPC Server" - contains the leaf "Connections" (see above).
"Blocks" - Contains PLC system data, PLC Organizational Blocks (OBs), PLC Function Blocks (FBs), PLC Functions (FCs), PLC System Functions (SFCs), PLC Data Blocks (DBs) and Variable Tables (VATs) needed for proper PLC functioning. These blocks have already been downloaded into the PLC memory and should not be changed.
WARNING!!! The PLC blocks and configuration parameters should be changed by authorized persons only!!!
Configuring PLC Hardware Components
PLC Hardware Components can be configured with the Hardware Configuration Manager - HW Config. The basic preview of the HW Config window for the SM0 TSS project is given in the Figure 16. This SIMATIC Manager should be used by authorized persons only!
Figure 16.
The node "CPU 315-2DP" in the SIMATIC Manager tree contains leaf "Connections" that can be used to access the Network Connections Configuration Manager (NetPro - Figure 17.) for the current project. This Manager is used to configure IP addresses of Ethernet Modules for all the Stations available in the Project Tree, and to perform additional parameterization of the all connections present in the system. Hereafter, only the procedure for configuration of IP addresses will be explained.
Figure 17.
Setting up the IP address of PLC Ethernet Communication Module (CP 343-IT)
The change of the IP address of PLC Ethernet Module is required whenever the PLC system is to be moved to a physically different network location (e.g. in the case of change of the network socket, the change of a building etc.).
This change MUST be performed AT THE OLD LOCATION with the old IP address, BEFORE the PLC has been really moved out. Once the new IP address has been downloaded to the PLC, it WILL NOT RESPOND from the old network location any more, but it will thereafter work from the new network location.
Figure 18.
The steps of this procedure are the following:
Obtain the IP address of the PLC for the new network location.
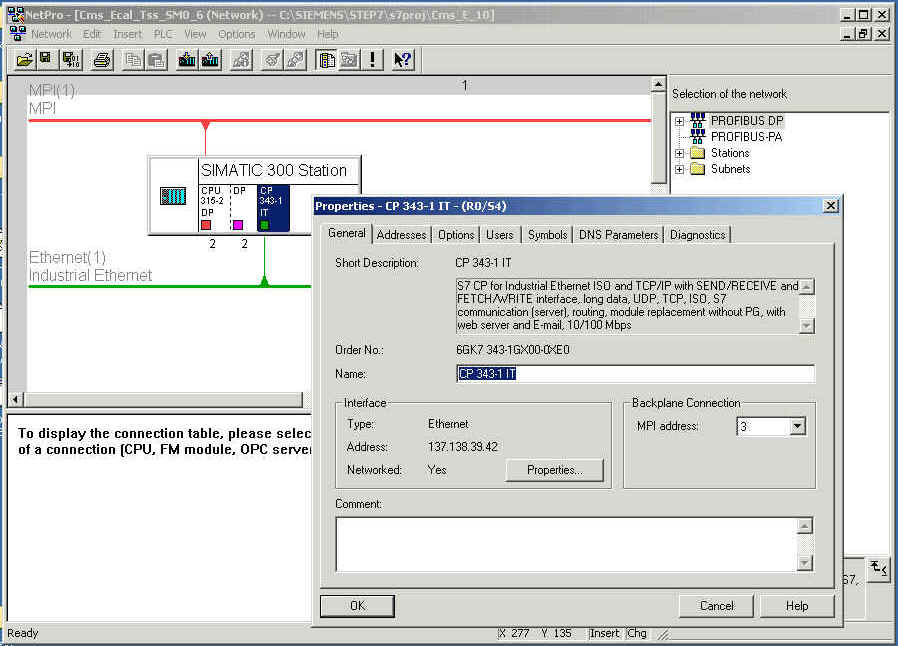
In the NetPro Manager select module CP 343-1 IT within SIMATIC 300 Station.
Open "Properties" of this module. The window "Properties 343-1 IT" similar to the one shown in the Figure 18. should appear on the screen.
Click on the button "Properties" within "Interface" frame. The window like the one shown in the Figure 19. should appear on the screen.
Enter the new IP address (and any additional network parameters) for the module in the appropriate edit-box.
Close all these open windows with "OK" button and download the new configuration to the PLC (use "download" button at the Manager Toolbar).
After this procedure has been completed, you can move the PLC to the new network location. The PLC will not work at the old network location any more.
Figure 19.
Setting up the IP address of OPC Server PC Station
The change of the IP address of OPC Server within the NetPro Manager is required whenever the PC System with OPC Server installed is to be moved to a physically different network location (e.g. in the case of change of the network socket, the change of a building etc.).
Figure 20.
The steps of this procedure are the following:
Obtain the IP address of the PC with OPC Server for the new network location.
In the NetPro Manager select the module "IE General" within "PC Station" (the module next to OPC Server in the Figure 17.).
Open "Properties" of this module. The window "Properties IE General" similar to the one shown in the Figure 20. should appear on the screen.
Click on the button "Properties" within the "Interface" frame. The window like the one shown in the Figure 19. should appear on the screen.
Enter the new IP address (and any additional configuration) for the module in the appropriate edit-box.
Close all these open windows with "OK" buttons and download the new configuration to the PLC (use "download" button at the Manager Toolbar).
After this procedure has been completed, the OPC connection between the PLC and the PC moved to the new network location should function properly. You can check the status of this connection in the way described above.
Downloading of PLC Step7 Programming Blocks into the PLC

Figure 21.
Variable Monitoring Table (VAT)
Figure 22.
TSS Monitoring Application - OPC Server and PVSS/TSS start-up
How do I start the OPC Server? What should I do if the OPC server is "down"?
If the OPC Server is down you should start it again either by starting OPC Scout and trying to connect to the server, or by restarting the PC where OPC Server is installed (the server will be started automatically after the PC has been rebooted).
One of the PVSS managers has not been started up properly? What should I do? Can I start it manually?
Yes. The right-click on the manager will give you the option "Start manager".
TSS Monitoring Application - How to use?
How do I select SM0 or SM1? What is the difference?
During the SM0 and SM1 testing, the only difference between the SMs inside the TSS Monitoring Application will be calibration coeficients for TSS sensors.
I cannot find temperatures on the Trend. What should I do?
You can either try to find temperatures by scrolling up-down right slide bar, or by pressing 1-1 button on PVSS Trend Toolbar.
TSS Monitoring Application - Alarm and Warning Situations
There has been an alarm. HV Kill signal is issued, and HV Ack. is OK, but there is no LV Kill signal. What should I do?
The LV Kill signal should be issued ~30 seconds after the HV Kill signal. If the signal has not been sent after this time (the value of the time can be check at the TSS Parameters Frame), you should check the status of LV System and call the DCS Experts immediately.
There has been an alarm. HV Kill signal is issued, but HV Ack. is NOT OK. What should I do?
You should immediately check the status of HV System. If it has not been shut down, you should contact the Experts and check if you should turn of the HV System manually
The Alarm Situations has passed, but HV and LV kill signals are still present. How do I clear the Alarm status?
TSS Monitoring Application - How to set-up or re-initialize TSS
Why do I need LV-to-HV interlock time delay? How do I set-up the value of this delay?
It is necessary to shutdown HV Power Supplies before LV Power Supply can be turned off in order to avoid the damage of FPPA chips on the ECAL FE boards. The time needed for HV to ramp down is approximately 30 seconds.
How do I clear the Warning or Alarm status? When should I do that?
This action should be taken when the problem that has caused an Alarm situation has disappeared from the system.
How can I reset TSS to its default values? When should I do that?
This action should be taken only if no other way could be found to solve eventual problem in the system.
Can I disable a specific sensor? How can I do that? When should I do that?
This action should be taken only if there is a real need to disable a certain sensor to generate an Alarm. This could particularly be helpful if there are some faulty sensors in the system.
TSS PLC - Siemens SIMATIC Step7 Software
When do I need Siemens SIMATIC Step7 Software?
The Siemens SIMATIC Step7 software should be used only in the case that some severe problems have occurred in the system, or if some hardware intervention is required. In both of these cases DSC Experts should be contacted first!